$298,295.15 in first year tax savings
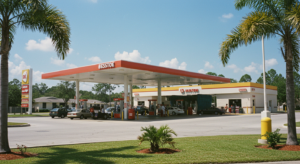
Without a Cost Segregation study, a $600,000 Restaurant in Kennewick, WA, purchased in 2018 would have gener-ated a 1st year depreciation of $6,410.26. By applying a cost segregation study, the property investors accelerate depreciation, for the 1st year to $304,705.41. This acceleration in deprecation allows the property investors to reduce their tax liability and in turn increase their bottom line. By breaking down the building asset into components, a cost segregation also aids in future benefits of abandonment, repairs, routine maintenance and overall asset management. ETS performs hundreds of cost segregation studies monthly for property owners, providing a detailed engineering review of assets including special purpose mechanical and electrical systems, decorative finishes, site improvements, and any process related to special purpose construction.
| Study Type | Class Life | Percentage | Accelerated Tax |
| Cost Segregation | 5-Year | 26.04% | $156,268.86 |
| Cost Segregation | 15-Year | 24.69% | $148,120.73 |
| Cost Segregation | 39-Year | 49.27% | $315.82 |
| Total 1st Yr Depreciation with Cost Seg | $304,705.41 | ||
| Total 1st Yr Depreciation without Cost Seg | $6,410.26 | ||
| Total Difference in Depreciation 1st Year | $298,295.15 |
% amounts relate to how much was reallocated from the depreciated basis
Cost Segregation is based on a 40% tax bracket for federal and State Taxes and performed on the ADR Asset Depreciation Range. Financial benefits are realized by maximizing net present value through deferring tax payments and using increased cash flow to strengthen your portfolio or scale your business. The tables above identify the difference between a cost segregation study and traditional 39.5-year capitalization. The line graph (if shown) demonstrates the impact of investment cash.


